Designing a quilt in R
To recap the previous post on this topic, I generated a quilt design in R using {ggplot2} and I was working through my overall plan:
- I wrote some functions to create a design using ggplot2 (post 1)
- I wrote some code to turn my image into something that could be printed as individual quilt blocks (this post)
- I made the actual quilt!
- I revisited how to make my process more general and implement something useful to design quilts that use foundation paper piecing
In this post, I will go through an overview of part 2.
The challenge - going from png to fabric
Once I had a design, I needed to figure out how to make the design into something that could actually be pieced together from fabric.
The approach I used is called foundation paper piecing. This is a technique that enables a quilter to make very intricate and precise designs by sewing fabric onto a piece of paper sequentially. This provides stability and precision by sewing along a printed line.
Foundation paper piecing (FPP for short) allows a quilter to make some incredible creations! Here is a link to the winners of this year’s Quiltcon awards. The people’s choice winner (a portrait of the artist’s family) was made using FPP.
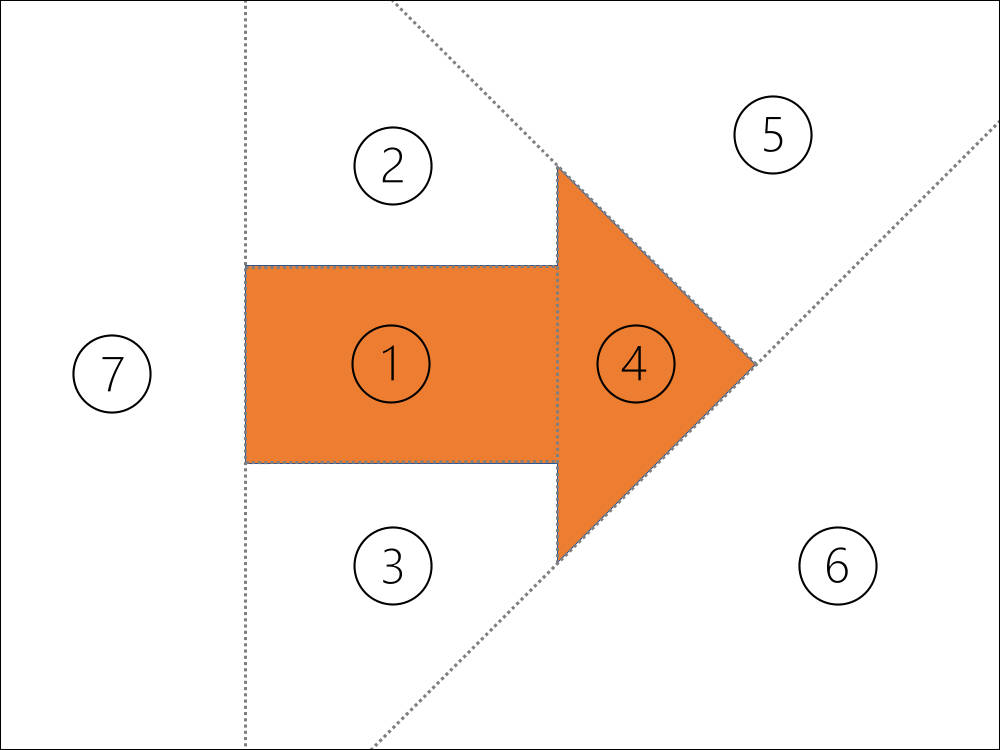
To create an entire FPP quilt, you need to break your larger design into smaller blocks that are “piece-able.” Here is the basic FPP “algorithm” (typically performed by hand):
A hypothetical starting design (keep in mind that the final quilt will actually be reversed as you sew onto the “wrong” side):

- Break the larger design into blocks (usually into blocks that can be sewn together into row or columns)

- Test whether the blocks are “piece-able” - not all shapes can be created!

If the blocks are not “piece-able” - break into smaller blocks
Create the seam lines on the block and label the sections by order
I am planning to save more information on steps 3 and 4 for a future post.
Here, I will just focus on how to do step 2 easily in R.
Converting the ggplot into a line drawing
My previous function, save_my_image(), creates the
design and can save an image.
design <- save_my_image(out_path = NULL, # don't need to save it
                   height_range = 10:40,
                   width_range = 20:80,
                   n_cubes = 3,
                   n_second_color = 1,
                   horizon_y = 80)

I created a new function, create_pattern_pdf, that takes
the data.frame and plots as line drawing with labeled polygons. The next
section breaks down how that works.
Breaking into pieces
One easy way to separate a large image into smaller blocks is just to use a program that can do tiled printing (such as Adobe Reader). However, that doesn’t give as much flexibility as you might like to select where to break up the image.
Below is how I turned a design - which was created on a 2D plane from (x,y) of (0,0) to (100,100) into a set of pdfs that were 8” by 8” to print.
Rescale to the size of the final quilt
grid <- tidyr::crossing(x = seq(0, width_blocks * 4, width_blocks),
                        y = seq(0, width_blocks * 4, width_blocks)) %>%
  mutate(x_end = x + width_blocks,
         y_end = y + width_blocks) %>%
  arrange(x, y)

head(grid)
# A tibble: 6 × 4
      x     y x_end y_end
  <dbl> <dbl> <dbl> <dbl>
1     0     0     8     8
2     0     8     8    16
3     0    16     8    24
4     0    24     8    32
5     0    32     8    40
6 8 0 16 8Loop through each block, plot and label, save out to a file. I tried to label each face an index to indicate color, but in my final design there were overlapping polygons, so colors needed to be manually checked for each block.
for (i in seq_len(nrow(grid))) {
  block <- design %>%
    bind_rows(missing_paths) %>%
    arrange(cube_id) %>%
    mutate(x = x*scale_factor, y = y*scale_factor) %>%
    group_by(id) %>%
    mutate(ave_x = mean(x), ave_y = mean(y)) %>%
    group_by(value) %>%
    mutate(color = cur_group_id()) %>%
    ungroup() %>%
    ggplot() +
    # horizon line
    geom_path(aes(x = x, y = y, group = cube_id),
              data = horizontal,
              color = "black",
              size = 1) +
    geom_polygon(aes(x = x, y = y, group = id),
                 fill = "white", color = "blue",
                 size = 1,
                 alpha = 1) +
    geom_text(aes(label = color, x = ave_x, y = ave_y)) +
    coord_equal(clip = "off",
                xlim = c(grid$x[i], grid$x_end[i]),
                ylim = c(grid$y[i], grid$y_end[i]),
                expand = FALSE) +
    theme_void() +
    theme(legend.position = "none",
          panel.border = element_rect(colour = "black", fill=NA, size=0.5))
  ggsave(plot = block,
         filename = paste0("to_print/",i,".pdf"),
         width = width_blocks, height = width_blocks)
}
For illustration purposes, here is what one of the blocks looked like. Now I could print (at 100% scale) and the squares were a perfect 8 inches.

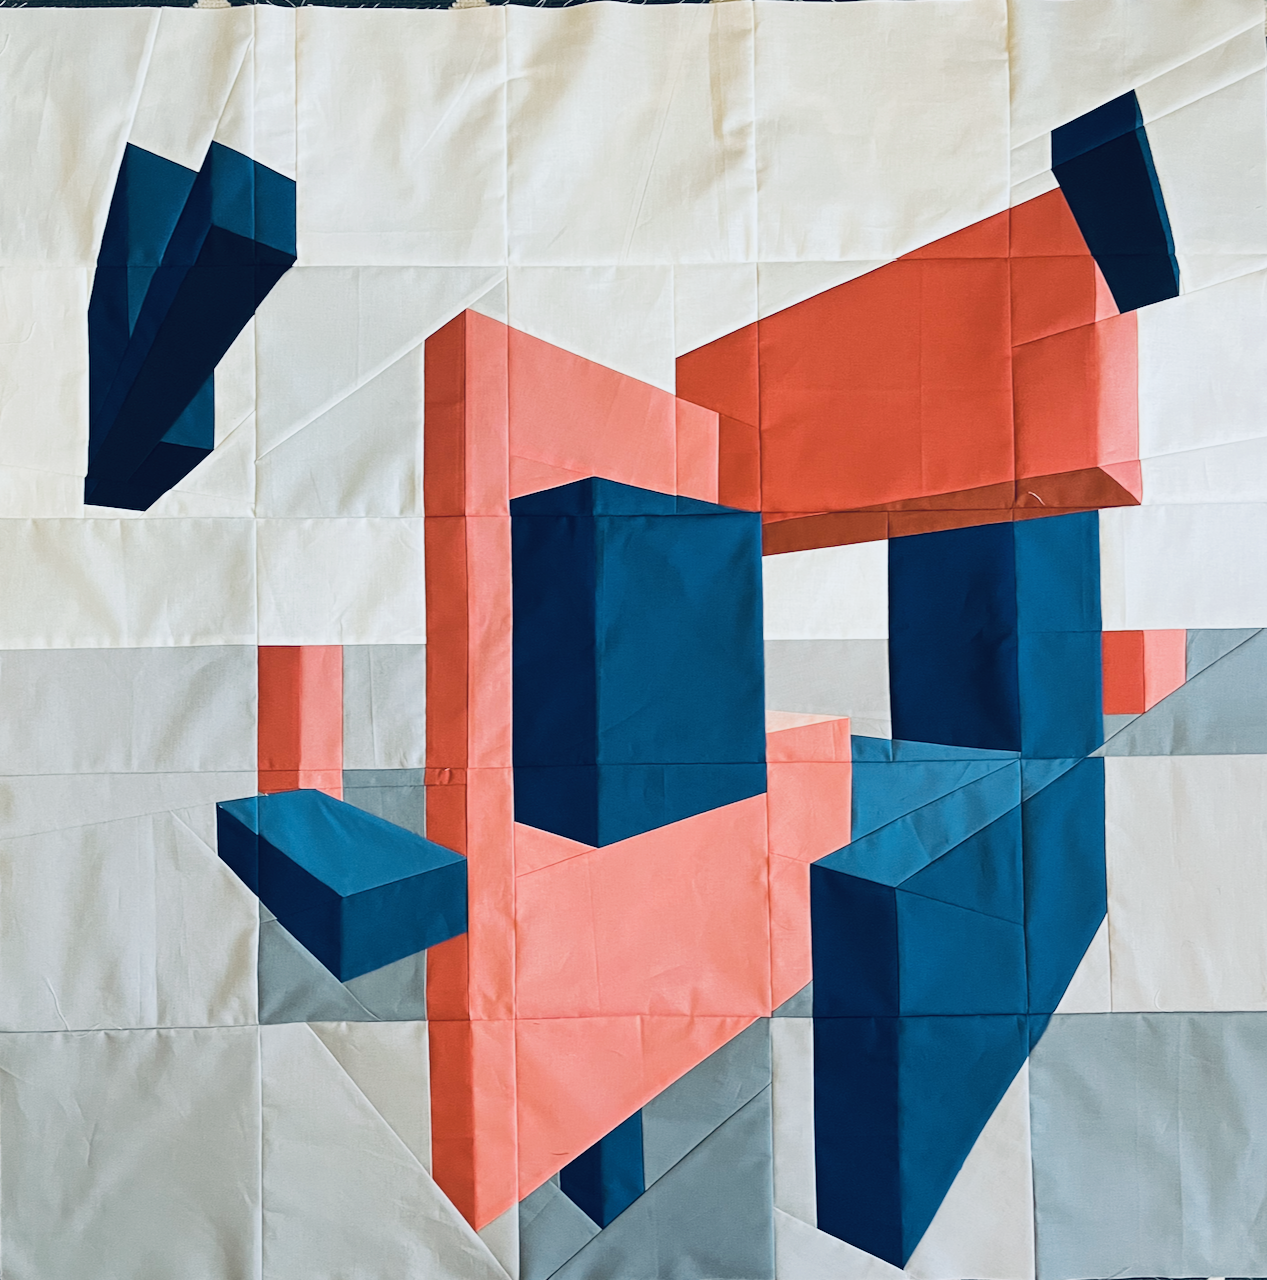
The finished quilt top
Here is a preview of the completed quilt top. I still need to actually quilt it, but the top does look like the original design!
The code is available in a GitHub repo.
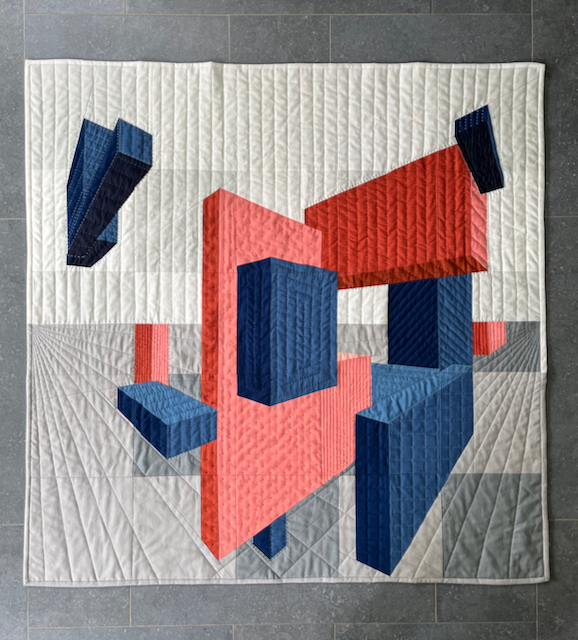
Updates
I wanted to add an image of the finished quilt and also point to the post on my RStudio::conf talk about quilting and creativity. I am inspired to try many more quilting ideas inspired by data or programming. Hopefully, I will add more posts with more details on this project and other projects soon.
sessionInfo
pander::pander(sessionInfo())
R version 4.0.5 (2021-03-31)
Platform: x86_64-apple-darwin17.0 (64-bit)
locale: en_US.UTF-8||en_US.UTF-8||en_US.UTF-8||C||en_US.UTF-8||en_US.UTF-8
attached base packages: stats, graphics, grDevices, utils, datasets, methods and base
other attached packages: ggplot2(v.3.3.6) and dplyr(v.1.0.9)
loaded via a namespace (and not attached): Rcpp(v.1.0.9), bslib(v.0.2.5.1), compiler(v.4.0.5), pillar(v.1.8.0), jquerylib(v.0.1.4), highr(v.0.9), tools(v.4.0.5), digest(v.0.6.29), downlit(v.0.4.0), gtable(v.0.3.0), jsonlite(v.1.8.0), evaluate(v.0.15), memoise(v.2.0.0), lifecycle(v.1.0.1), tibble(v.3.1.8), pkgconfig(v.2.0.3), png(v.0.1-7), rlang(v.1.0.4), cli(v.3.3.0), DBI(v.1.1.1), rstudioapi(v.0.13), distill(v.1.3), yaml(v.2.3.5), xfun(v.0.31), fastmap(v.1.1.0), withr(v.2.5.0), stringr(v.1.4.0), knitr(v.1.39), generics(v.0.1.3), vctrs(v.0.4.1), sass(v.0.4.0), grid(v.4.0.5), tidyselect(v.1.1.2), glue(v.1.6.2), R6(v.2.5.1), fansi(v.1.0.3), rmarkdown(v.2.11), pander(v.0.6.3), tidyr(v.1.2.0), purrr(v.0.3.4), magrittr(v.2.0.3), scales(v.1.2.0), htmltools(v.0.5.1.1), assertthat(v.0.2.1), colorspace(v.2.0-3), utf8(v.1.2.2), stringi(v.1.7.8), munsell(v.0.5.0) and cachem(v.1.0.5)